Iris Dataset Classification
ROLE:
Sole developer
TIMELINE:
October 2024 (20 days)
(Updated for portfolio showcase)
SKILLS:
Data Mining
Statistical Analysis
-
This project models iris species based on petal length & width as well as sepal (green part underneath bloom) length & width. I classified this data based on 2 classic algorithms: K-NN & Decision Trees and evaluated their performance.
-
The data is sourced from the Fisher Iris dataset, 1936. It is one of the earliest known datasets used for evaluating classification methods.
Total Iris Samples: 150
Setosa Count = 50
Versicolor Count = 50
Virginica Count: 50
Input data (features):
Sepal Length (cm)
Sepal Width (cm)
Petal Length (cm)
Petal Width (cm)
-
1. Classification Results:
Average Metrics (Stratified 5-Fold Cross-Validation):
A. 3-NN Average Metrics:Accuracy: 0.9533 ± 0.0340
Precision: 0.9560 ± 0.0322
Recall: 0.9533 ± 0.0340
F1: 0.9532 ± 0.0341
B. Decision Tree Average Metrics:
Accuracy: 0.9333 ± 0.0422
Precision: 0.9432 ± 0.0324
Recall: 0.9333 ± 0.0422
F1: 0.9321 ± 0.0439
2. Broad data insights:
Mean sepal length = 5.843 ± 0.828 cm
Mean Sepal Width = 3.054 ± 0.434 cm
Mean Petal Length = 3.759 ± 1.76 cm
Mean Petal Width = 1.199 ± 0.763 cm
3. Species-specific Inisghts:
A. Average Petal Area
Setosa ≈ 0.357 cm^2
Versicolor ≈ 5.65 cm^2
Virginica ≈ 11.2 cm^2
B. Average Sepal Area:
Setosa = 17.1 cm^2
Versicolor = 16.4 cm^2
Virginica = 19.6 cm^2
-
Small test set size
- 70-30 train-test split only allows for 45 total predictions-Highly subject to sampling bias
- I counteracted somewhat using 5-fold cross-validationLimited Experimentation with model types jk
- only tests 2 models
- maybe test Naive Bayes, LogRes, or Linear SVM in the future?
Graphical Analysis
Confusion Matrices
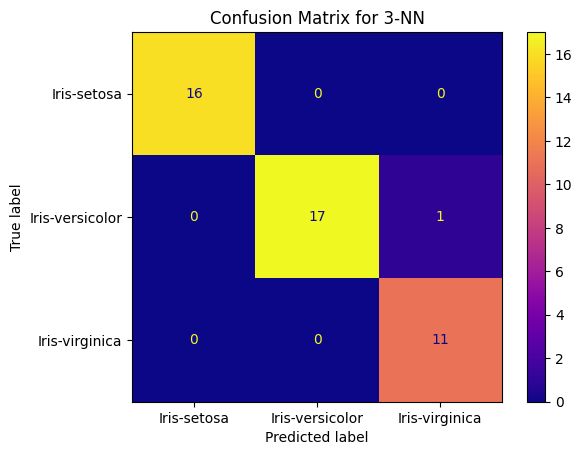
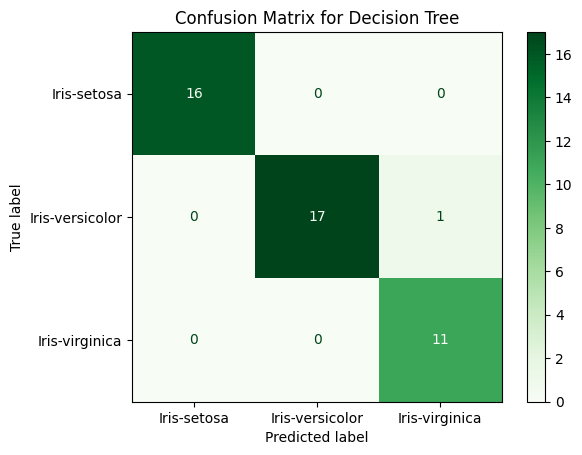
At first, I thought both confusion matrices having the same result was a result of faulty code, but after triple checking my code and re-running the experiment with different random state values, I can confirm these matrices are correct. It is possible for both to have the same result (one versicolor incorrectly identified as Viriginica), especially in a clean and well-separated dataset like this one.
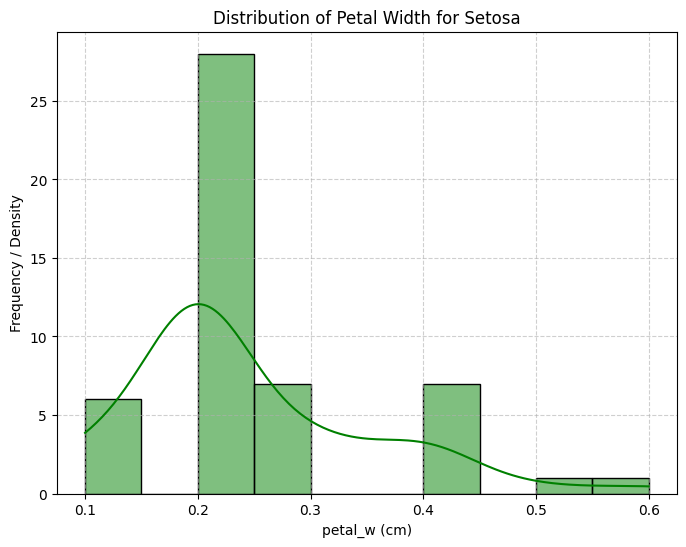
2. Value Distribution of Data Features
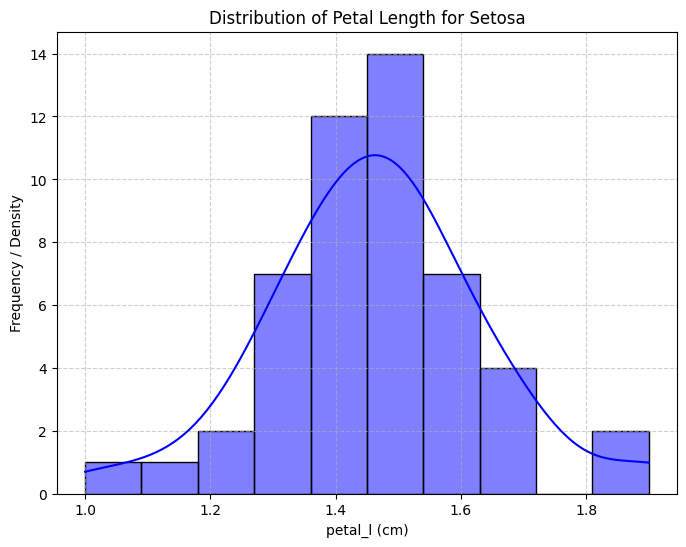
Petal length for Iris Setosa closely followed a normal distribution.
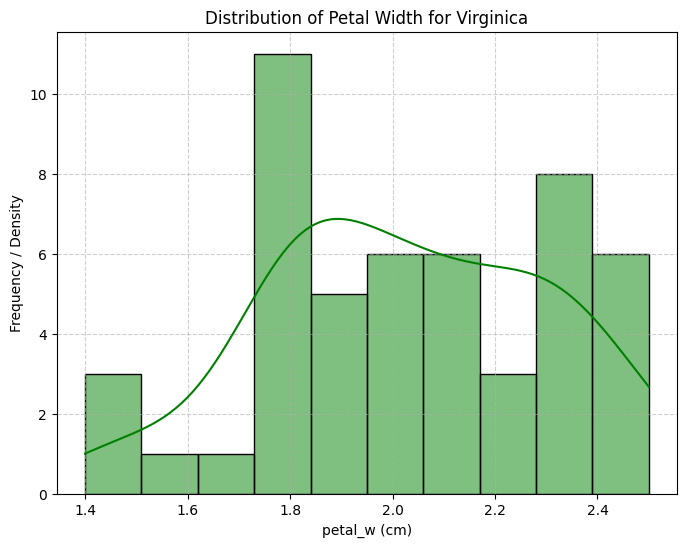
Petal width for Iris Virginica was the only feature to approximate a bimodal distribution.
While petal width was right-skewed!
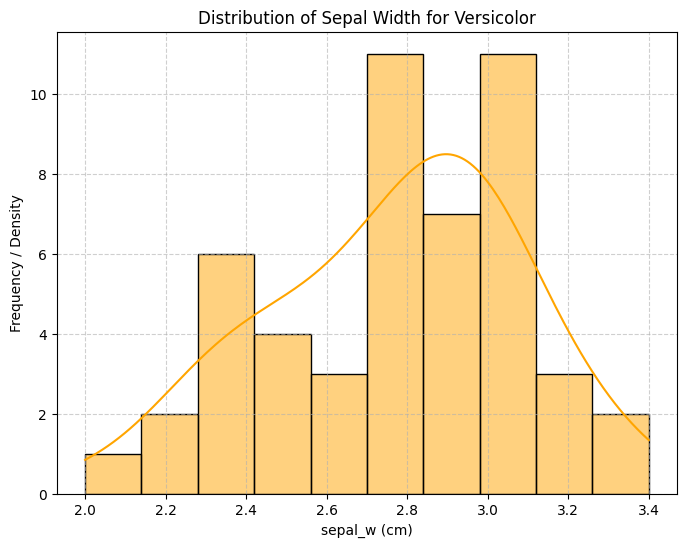
Others still, like, petal width for Versicolor, were right-skewed.